decorative

How Has Low Volatility Performed in Down Markets?

We explore how minimum- and low-volatility equities have behaved over the last 20 years, given the relatively strong equity markets, and how those lower-risk stocks have performed during past market drawdowns.

Because of the speed, severity and indiscriminate nature of the Covid drawdown in 2020, investors may believe that lower-volatility strategies have not provided the downside protection expected in those types of market environments. Over the longer term we've seen equity markets post strong returns fueled by low rates and accommodative monetary policies. The MSCI ACWI and S&P 500 indices yielded positive returns in 15 of the past 20 years, and posted returns of more than 15% in half of those years. In an era when acronyms such as TINA (there is no alternative to equities) were used, it’s reasonable to assume a more defensively positioned strategy would have trailed. In this paper we will look at the MSCI ACWI & S&P 500 indices versus their comparable minimum-volatility or low-volatility indices across a number of drawdown periods to help us understand how the lower-risk indices did and whether they kept pace in the 20 year long risk-on environment.

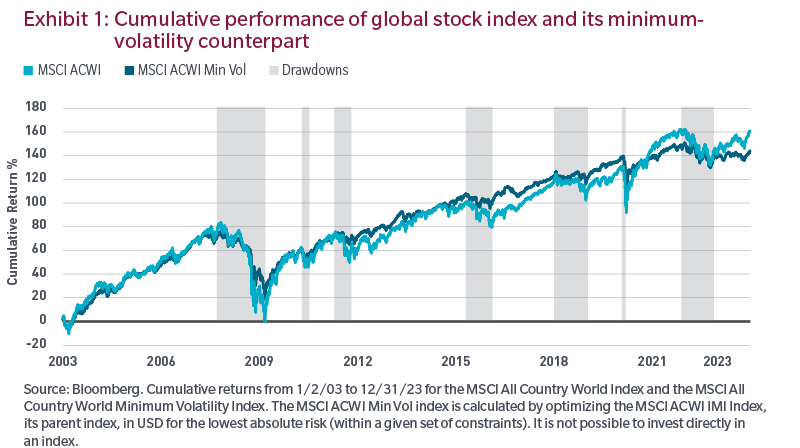
Exhibits 1 and 2 show the 20-year cumulative return of both cap-weighted indices along with their minimum-volatility counterparts. Given the strong equity market returns over the past two decades, it’s surprising to see the minimum-volatility index performed almost as well as the cap-weighted one despite a lower-risk profile.

a

The reason low-volatility stocks can keep pace with the overall market is the emphasis placed on downside protection, or not losing as much in a downturn. Take, for instance, the stylized example in Exhibit 3. At T0, an asset is worth $100. If that asset were to lose 50% of its value at T1, it would be worth $50. To get back to its original value, how much would it need to increase? One hundred percent. This simple math helps explain how a more defensive strategy can keep pace through a market cycle.

The ability to keep pace with broad indices on a cumulative basis across market environments is an important characteristic of low-volatility stocks, but investors may be questioning how effective they are at providing downside protection during drawdowns. Exhibit 4 looks at all global market selloffs of greater than 15% since October, 2007. Have minimum-volatility strategies always held up in market drawdowns consistent with expectations? Not necessarily. However, on an absolute basis, they went down less than the cap-weighted benchmark in all seven instances. If we use a 75% or less downside capture as a reasonable expectation for a lower volatility strategy over the long term, but especially in extreme down markets, we see that the min vol index performed very well, the exception being the Covid sell-off in early 2020. We believe that those types of unusual drawdowns are the exception and not the rule. In the other six periods the average drawdown was 52% of the cap-weighted index.

Exhibit 5 is a similar analysis of the US low-volatility index and shows how much it declined compared to the cap-weighted index both on a relative basis and as a percentage. We see a similar experience in the US, with the low-volatility index capturing less of the drawdown than the cap-weighted index in four out of five periods, the Covid drawdown being the outlier. In that short period of time sectors that typically exhibited low volatility became much more volatile while those with higher forecasted volatility, such as technology, were viewed by investors as defensive in the new reality of remote work. We believe the market environment of early 2020 was extremely unusual in historical terms and was driven largely by the unique economic circumstances we found ourselves in at that time.

In conclusion, we believe that lower-risk strategies highlighted by minimum- and low-volatility indices have managed to keep up with their cap-weighted counterparts while also meeting expectations to provide downside protection in the most severe drawdowns, the early 2020 drawdown being the exception. We believe that a low volatility investment approach may provide solid risk-adjusted returns and a smoother ride to solid long-term capital appreciation. Over a full market cycle with ups and downs, a low volatility portfolio that avoids big losses should compound capital at a higher rate, and in doing so, it may “win by not losing”.


Endnotes

1 Source, Factset, as of 12/31/22.


Source: Bloomberg Index Services Limited. BLOOMBERG® is a trademark and service mark of Bloomberg Finance L.P. and its affiliates (collectively “Bloomberg”). Bloomberg or Bloomberg’s licensors own all proprietary rights in the Bloomberg Indices. Bloomberg neither approves or endorses this material or guarantees the accuracy or completeness of any information herein, or makes any warranty, express or implied, as to the results to be obtained therefrom and, to the maximum extent allowed by law, neither shall have any liability or responsibility for injury or damages arising in connection therewith.

Index data source: MSCI. MSCI makes no express or implied warranties or representations and shall have no liability whatsoever with respect to any MSCI data contained herein. The MSCI data may not be further redistributed or used as a basis for other indices or any securities or fi nancial products. This report is not approved, reviewed or produced by MSCI.

“Standard & Poor’s®” and S&P “S&P®” are registered trademarks of Standard & Poor’s Financial Services LLC (“S&P”) and Dow Jones is a registered trademark of Dow Jones Trademark Holdings LLC (“Dow Jones”) and have been licensed for use by S&P Dow Jones Indices LLC and sublicensed for certain purposes by MFS. The S&P 500® is a product of S&P Dow Jones Indices LLC, and has been licensed for use by MFS. MFS’ Products are not sponsored, endorsed, sold or promoted by S&P Dow Jones Indices LLC, Dow Jones, S&P, or their respective affi liates, and neither S&P Dow Jones Indices LLC, Dow Jones, S&P, their respective affi liates make any representation regarding the advisability of investing in such products.

The views expressed are those of the author(s) and are subject to change at any time. These views are for informational purposes only and should not be relied upon as a recommendation to purchase any security or as a solicitation or investment advice. No forecasts can be guaranteed.

54859.1
close video