decorative
decorative

The Big Mac on Cash Allocation: Time to Retire the CD Player*

With the federal funds rate at or near peak levels, we believe that cash is likely to start underperforming credit in the period ahead. We favor deploying some credit risk as an attractive alternative to a cash allocation.

Cash has been a popular asset class in recent months. Under the “fear of the Fed” macro regime, cash has been able to offer some protection from rising rates and severe risk aversion shock while also providing meaningful yields. But the macro backdrop has radically changed. With the federal funds rate at or near peak levels, we believe that cash — as expressed as certificates of deposit (CD) — is likely to start underperforming credit in the period ahead. We favor deploying some credit risk as an attractive alternative to a cash allocation. 

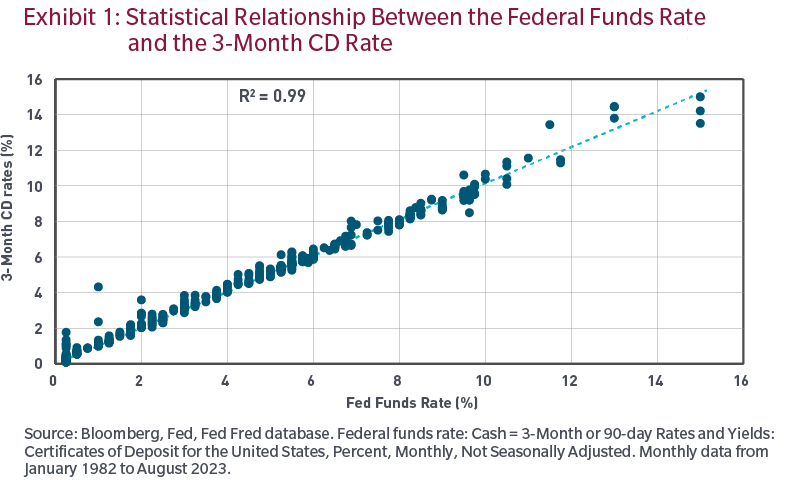
Given that the Fed tightening cycle is (virtually) over, we believe cash is likely to underperform credit going forward. The peak of central bank rates has historically been a major turning point with respect to the underperformance of cash relative to fixed income. In this report, we analyze cash performance using the 3-month US certificate of deposit (CD) rate, for which long-term data are easily available. As illustrated by Exhibit 1, there has been an extremely high correlation between the federal funds rate and the 3-month CD rate. In other words, the CD rate has historically been determined by the US Federal Reserve’s policy rate. 

Historically, cash has started underperforming short-tenor credit shortly after a federal funds rate peak. Analyzing the historical data of the Fed’s monetary policy since 1982, we have identified six different Fed tightening cycles. Overall, cash performance fell below that of short-tenor credit three months after  the peak of the federal funds rate on average, as shown in Exhibit 2. The relative returns of credit against cash indeed tended to recover to positive territory shortly after the Fed rate has reached its cycle peak.

The magnitude of the cash underperformance has tended to increase with time. In the early months following the end of a Fed tightening cycle, historically, cash underperformance was modest. Three months after the peak for instance, short-tenor credit outperformed cash by only 0.94% on average. But the cash underperformance then became more significant and reached an average of 3.6% by month nine and stayed elevated thereafter (Exhibit 3).

We are potentially already in month T+2. There is still an ongoing debate about whether the Fed has already completed its tightening cycle or not, following its most recent rate hike in July, but we have essentially either reached the end or are very near the end of this tightening cycle. As we see it, there are plenty of compelling arguments that support the view that the Fed has already reached its cycle rate peak. In particular, substantial progress on the disinflation front has provided a much higher degree of comfort for the central bank. If indeed this is month T+2, this suggests that, based on our historical data analysis, cash underperformance may be just around the corner.

Based on current Fed policy pricing, cash rates are set to decline over the next few quarters. As discussed above, the main driver of cash rates is the federal funds rate. Now, the federal fund futures curve points to the possibility of the federal funds rate cut to 4.96% by the end of 2024, with rate cuts beginning in Q3. This rate move would undermine the outlook for cash performance.

Looking at the macro backdrop, deploying more credit risk makes sense, in our view. This is because the macro-outlook has improved over the past few weeks, with fears of recession now receding — somewhat. Indeed, the case for a soft landing has strengthened, which is less supportive of a highly defensive bias. This is an important development for fixed income as it potentially reduces the risk of severe spread widening in the event of a recession. However, given the speed and magnitude of this hiking cycle, the risk of further aggressive tightening appears low, which would be constructive for fixed income. Our business cycle indicator now shows that the risk of recession has declined markedly even though the risk of a significant growth slowdown remains present (Exhibit 5). 

Market rates have risen recently for the right reasons. Last year, the rate correction was primarily driven by inflation shock. This is no longer the case. We would now argue that the recent rate move reflects the improvement in the growth outlook. But looking ahead, we do not believe that the rate correction is sustainable. Our rate view is that market rates will stabilize at a higher level and rate volatility will moderate, which is supportive of long-term fixed income returns. 

In our view, the valuation picture of short-tenor credit looks quite favorable. For a start, the current yield on short-tenor credit stands at around 6.0%, which is quite high by historical standards, and some 60 basis points higher than current CD rates (Exhibit 6). This means that with a duration of 1.8, the short-tenor credit index would have to suffer a 30 bp upward rate move for the performance to break even with that of the 3-month CD rates (assuming that the CD rate remains unchanged during the same period). The higher starting yield helps lower the risk of lower returns. Exhibit 7 displays the various combinations of one-year return projections for 1–3 year US IG credit under multiple rate and spread move scenarios. Overall, only an extreme scenario (shown in red) would lead to a negative return over a one-year period.

Historically, starting yields have tended to be correlated with subsequent returns. Historical data suggest a strong relationship between entry yields and subsequent returns. In historical periods when the short-tenor credit starting yield was between 4.6% and 5.2% — a 30 bp range around the current yield — subsequent 5-year returns ranged between 4.4% and 5.46%, with a median return of 4.72% (Exhibit 8).

Overall, with the end of the Fed’s tightening cycle upon us, we believe it may be time to retire the CD player. Indeed, we believe cash is likely to underperform short-tenor credit in the period ahead. We are constructive about deploying some credit risk as an alternative to the cash allocation, reflecting the attractive valuation, the improved growth backdrop and the favorable inflation dynamics


Endnotes

The BCI incorporates the following variables: Initial jobless claims (Department of Labor), Building permits (US Census Bureau), Philadelphia Fed business outlook survey diffusion index (Philadelphia Fed), New home sales (US Census Bureau), Consumer sentiment index (University of Michigan), Consumer sentiment index Conference Board), Capex expectations index aggregated from the Fed regional surveys (New York, Richmond, Dallas, Kansas City, Philadelphia), ISM new orders (Institute for Supply Management), Corporate profit margin changes (Bureau of Economic Analysis), Corporate profit growth (Bureau of Economic Analysis), Corporate profit margin level (Bureau of Economic Analysis), Output gap (Congressional Budget Office), US Consumer Price Index – Energy (Bureau of Labor Statistics), Empire State manufacturing survey (New York Fed), National Association of Home Builders Market Index (NAHB), NFIB Small Business Optimism Index (NFIB), Housing starts (Census bureau), Senior Loan Officer Opinion Survey, Net % of Domestic Respondents Tightening Standards for C&I Loans for Small Firms (Fed), ISM manufacturing (Institute for Supply Management), ISM Services (Institute for Supply Management), Investment ratio: Fixed investment as % of GDP, transformed into monthly series through interpolation (Bureau of Economic Analysis), Compensation Ratio change. Personal Income Compensation of Employees Received as % of GDP. 12-month change in the ratio (Bureau of Economic Analysis), Unit labor cost (Bureau of Labor Statistics).

*The Big Mac, which is a hint at big macro, is a periodic global fixed income note that discusses relevant topics in the global fixed income/global macro environment.


Source: Bloomberg Index Services Limited. BLOOMBERG® is a trademark and service mark of Bloomberg Finance L.P. and its affi liates (collectively “Bloomberg”). Bloomberg or Bloomberg’s licensors own all proprietary rights in the Bloomberg Indices. Bloomberg neither approves or endorses this material or guarantees the accuracy or completeness of any information herein, or makes any warranty, express or implied, as to the results to be obtained therefrom and, to the maximum extent allowed by law, neither shall have any liability or responsibility for injury or damages arising in connection therewith.

The views expressed are those of the MFS Investment Solutions Group within the MFS distribution unit and may differ from those of MFS portfolio managers and research analysts. These views are subject to change at any time and should not be construed as the Advisor’s investment advice, as securities recommendations, or as an indication of trading intent on behalf of MFS.

56056.1
close video