decorative
decorative

The Big Mac on Macro Regimes: The Market Paradigm Shift

The prevailing macro regime, the “fear of the Fed,” is likely to end in the near future. A shift away from it should bring better prospects for fixed income returns, and in our view it may be time to consider raising allocations to fixed income.

We are likely to witness a paradigm shift in global markets. The prevailing macro regime, the “fear of the Fed,” is likely to end in the near future. We believe as we transition from this regime, the market narrative will shift from liquidity to growth. The fear of the Fed was the worst-case scenario for bonds. A shift away from it should bring better prospects for fixed income returns, and in our view it may be time to consider raising allocations to fixed income.

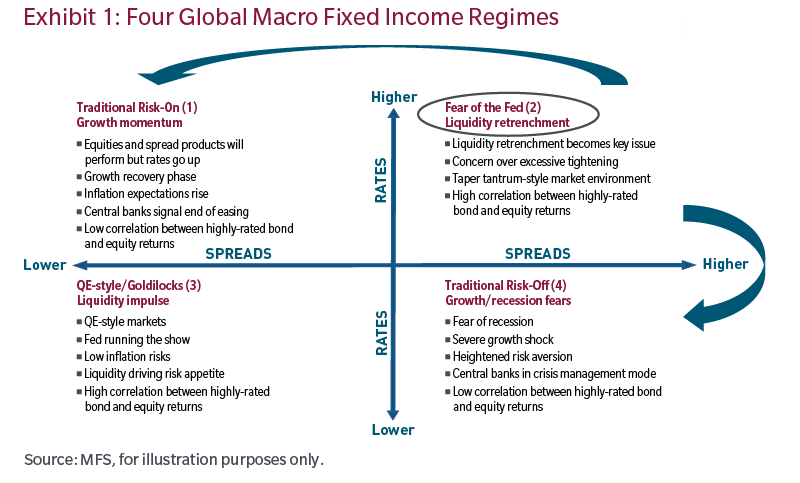
The fear of the Fed is over. The fear of the Fed macro regime took hold in late 2021, when it became clear that the beginning of the US Federal Reserve’s tightening cycle was imminent. The dominance of this macro regime had devastating consequences for global markets, with many asset classes suffering their largest losses in decades as interest rates moved higher. Meanwhile, credit spreads widened and risky assets, including equities, sold off aggressively (see top-right quadrant of Exhibit 1).1

In addition, the correlation between bonds and equities turned positive, undermining fixed income’s value proposition as a portfolio diversifier (Exhibit 2). But we now believe the days of the fear of the Fed as the dominant macro regime are numbered, largely because the Fed’s tightening cycle is coming to an end. With this shift in the macro regime, we expect the bond-equity correlation to revert to the norm of the past two decades. The evidence for this is that the short-term correlation, which tends to be more responsive, has already corrected lower, with the 60-day rolling correlation between bonds and equities now turning negative.2 We believe the two-year medium-term correlation illustrated below will begin to move lower throughout the year.

Sentiment should be bolstered. There is little reason to fear the Fed as the tightening cycle is about to be completed. Some market participants are talking about a “skip” in June — meaning the central bank will not raise its policy rate then — to be followed by a final rate hike in July. Others believe the tightening cycle is already over. Either way, the Fed is about to take a back seat as a global market driver. At this juncture, the implied pricing of the central bank’s terminal rate stands at 5.42% for August 2023, suggesting an additional 17 basis points of tightening from the current level, or another almost-25-basis-point hike priced in (Exhibit 3). We believe the end of the tightening cycle will help bolster investor sentiment, albeit trigger some rate volatility normalization as the main cause of recent volatility, an aggressive policy cycle, is removed. For the time being, rate volatility continues to be elevated, with the MOVE index standing at 124, well above its five-year average of 77. We anticipate, however, that the MOVE index will decline in the period ahead.3

The paradigm is likely to shift from liquidity to growth. The fear of the Fed regime has been observed 50% of the time since 2022 (Exhibit 4); we call it a liquidity-dominant regime, because liquidity acts as the main market driver. During such a regime, investors are most worried about the impact of liquidity retrenchment. We think the main market narrative will shift to growth in the period ahead, with recession concerns becoming the main market fear. There are two distinct regimes in the growth-dominant category: growth fears and growth momentum (see Exhibit 1). Under the growth/recession fear regime, rates decline while spreads widen as a higher risk of recession is being priced in. At the opposite end of the growth spectrum, the growth momentum regime tends to be characterized by higher rates and narrower spreads. It is a potential outcome in the near term, especially if the United States manages to avoid a recession. The key risk to our view is a prolonged hawkish bias on the part of the central bank, which would extend fear of the Fed and almost inevitably lead to a more severe recession.

This is likely the end of the business cycle. In our view, it is more likely than not that the US will enter a recession in the near future. The date commentators are predicting it will begin keeps getting later given the resilience of the US economy. While making the call on a recession is more an art than a science, a reasonable prediction is that a recession will begin in the fourth quarter of this year. Preliminary activity data observations suggest any US recession will be mild given the absence of obvious systemic balancesheet imbalances. There is still uncertainty about the growth outlook in this base case, however, with risks on both sides. A soft landing — a slowdown that is not significant enough to qualify as a recession — cannot be ruled out. But a severe recession could also materialize if major financial excesses come to light, in the private asset universe for instance, or if financial stability risks escalate further.

Our recession risk monitoring points to a slow grind toward recession. There is still a wide disparity among the growth signals across the spectrum of leading indicators. The most alarming recession signals come from so-called soft data, in particular the surveys on business sentiment, consumer sentiment and lending conditions. Nevertheless, corporate profit margins remain elevated and the labor market continues to be strong, as illustrated by low initial job claims (Exhibit 5). In addition, our Business Cycle Indicator (BCI) is currently signaling the risk of a severe slowdown but not an imminent recession (Exhibit 6). In the past, the BCI level associated with severe recession risks has been closer to -1 than -0.47.

The market paradigm shift is set to support fixed income. The fear of the Fed regime was the worstcase scenario for fixed income. A shift away from this regime is likely to induce better prospects for fixed income returns, in our view. Under fear of the Fed, both rates and spreads rose, thereby acting jointly to hurt total return. This is why we observed returns in negative double-digit territory for most global fixed income asset classes in 2022. In contrast, under growth-dominant regimes, spread and rate moves are expected to offset each other, which means the potential shock to returns is no longer amplified. Looking at the matrix of potential outcomes for rate and spread moves for US investment-grade credit, one can see that the projected return over a one-year horizon will turn negative only in the event of significant market moves. For instance, under the growth fear regime, the US investment-grade one-year return projection will fall into negative territory only if the net change of combined rate and spread moves reaches at least 90 basis points — a spread widening of 120 basis points with a rate drop of 30 bps for a net 90 bps move. While a move of such magnitude cannot be ruled out, it would tend to be associated with a severe recession scenario. Overall, we believe that the probability of negative returns for fixed income is likely to be lower going forward after the recent upward rate correction. This is because of the higher income arising from higher yields, which then acts as a higher bar against negative absolute returns.

Overall, we believe this may be an opportune time to consider increasing allocations to fixed income in anticipation of this positive market paradigm shift.


Endnotes

The four-quadrant diagram describes the four possible macro fixed income regimes based on the moves of rates and spreads: the fed of the Fed, growth/recession fears, quantitative easing, and growth momentum. Under the fear of the Fed regime, for instance, both rates and spreads rise. Under the growth fears regime, spreads widen but rates decline.

Source: Bloomberg. Short-term correlation is calculated as the 60-day rolling correlation of daily UST and S&P 500 returns. UST = Bloomberg US Treasury index. The data as of 2 June 2023 show a correlation coefficient of -0.48.

Bloomberg. ICE BofA Move index is a yield curve weighted index of the normalized implied volatility on 1-month Treasury options. It is the weighted average of volatilities on the CT2, CT5, CT10, and CT30. Data as of 2 June 2023.

The BCI incorporates the following variables: Initial jobless claims (Department of Labor), Building permits (US Census Bureau), Philadelphia Fed business outlook survey diffusion index (Philadelphia Fed), New home sales (US Census Bureau), Consumer sentiment index (University of Michigan), Consumer sentiment index Conference Board), Capex expectations index aggregated from the Fed regional surveys (New York, Richmond, Dallas, Kansas City, Philadelphia), ISM new orders (Institute for Supply Management), Corporate profit margin changes (Bureau of Economic Analysis), Corporate profit growth (Bureau of Economic Analysis), Corporate profit margin level (Bureau of Economic Analysis), Output gap (Congressional Budget Office), US Consumer Price Index (Bureau of Labor Statistics), Empire State manufacturing survey (New York Fed), National Association of Home Builders Market Index (NAHB), NFIB Small Business Optimism Index (NFIB), Housing starts (Census bureau), Senior Loan Officer Opinion Survey, Net % of Domestic Respondents Tightening Standards for C&I Loans for Small Firms (Fed), ISM manufacturing (Institute for Supply Management), ISM Services (Institute for Supply Management), Investment ratio: Fixed investment as % of GDP – transformed into monthly series through interpolation (Bureau of Economic Analysis), Compensation Ratio change. Personal Income Compensation of Employees Received as % of GDP. 12-month change in the ratio (Bureau of Economic Analysis), Unit labor cost (Bureau of Labor Statistics).


Source: Bloomberg Index Services Limited. BLOOMBERG® is a trademark and service mark of Bloomberg Finance L.P. and its affi liates (collectively “Bloomberg”). Bloomberg or Bloomberg’s licensors own all proprietary rights in the Bloomberg Indices. Bloomberg neither approves or endorses this material or guarantees the accuracy or completeness of any information herein, or makes any warranty, express or implied, as to the results to be obtained therefrom and, to the maximum extent allowed by law, neither shall have any liability or responsibility for injury or damages arising in connection therewith.

The views expressed are those of the author(s) and are subject to change at any time. These views are for informational purposes only and should not be relied upon as a recommendation to purchase any security or as a solicitation or investment advice. No forecasts can be guaranteed.

55149.1
close video