
Decoding Equity Benchmarks: A Closer Look at Index Construction
AUTHORS
Ross Cartwright
Strategy & Insights Group
Jonathan Hubbard, CFA
Strategy & Insights Group
Introduction
Benchmarks are deeply embedded within investment industry practices and heavily relied upon for market and portfolio analysis. They act as an important reference point to help examine multiple dimensions of a portfolio, from performance-based measures such as risk and return to aggregate market fundamentals such as valuation and growth rates.
Yet a closer look at benchmarks reveals a striking irony: these instruments, which were originally designed as measurement tools, are rarely analyzed with the same rigor as the strategies that are compared to them. As a result, the assumptions that underpin benchmark construction often become unquestioned truths, potentially leading to decisions based on inadequate information or portfolios being exposed to unintended risks.
This paper explores how benchmarks came to occupy their current role in the industry, why their construction methodologies matter more than many investors realize, and why decoding benchmarks in today’s ever-changing equity market environment is more important than ever.
The Origins and Evolution of Benchmarks
In 1884, Charles Dow averaged the share prices of 11 railroad stocks to create the Dow Jones Railroad Index, which was published in the Customer’s Afternoon Letter, the precursor to the Wall Street Journal. In 1896, the Dow Jones Industrial Index was introduced to provide a more comprehensive view of the stock market. The purpose was modest: readers and investors needed a reference point for US economic activity and to understand whether the stock market was rising or falling. At the time, the US economy was heavily industrialized, with the largest public companies focused on manufacturing. As such, the US economy and US stock market were tightly correlated.
What followed in subsequent decades was a steady proliferation of different indices and methodologies:

Beyond being important measurement tools, benchmarks grew to play an important role in the research and analysis efforts of both practitioners and academics. Aggregating and classifying stocks by various attributes such as market capitalization and style facilitated more in-depth analysis, both cross-sectionally and over time, leading to a significant body of markets-related work.
The Methodology Challenge
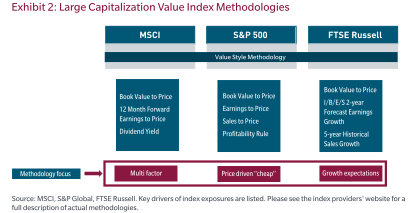
As the popularity of benchmarks grew, so did their complexity and construction. Understanding how benchmarks are constructed is essential because that methodology might determine not only what an investor owns but also the size of that ownership. Consider value-style investing: each of the three most widely used index providers has a different methodology for determining what constitutes a “value” stock for inclusion in their value indices. MSCI employs a multi-factor blend that integrates value, growth, and quality signals. S&P focuses on price-driven cheapness using book value, earnings, and sales ratios. Russell tilts toward growth expectations, incorporating forward earnings forecasts alongside traditional value metrics.
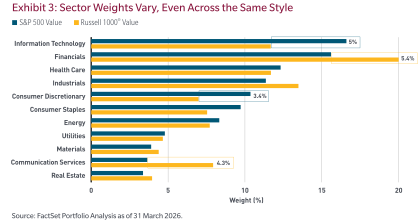
Unsurprisingly, the consequences of these definitional differences are far from trivial. Focusing on the S&P 500 Value and Russell 1000® Value indices, for example, four sectors — including the two largest, information technology and financials — have had relative sector weight differences of more than 3%. These inconsistencies can lead to meaningful differences in return patterns, with the tracking error between these ostensibly similar value benchmarks averaging 2.3% over the past 20 years.
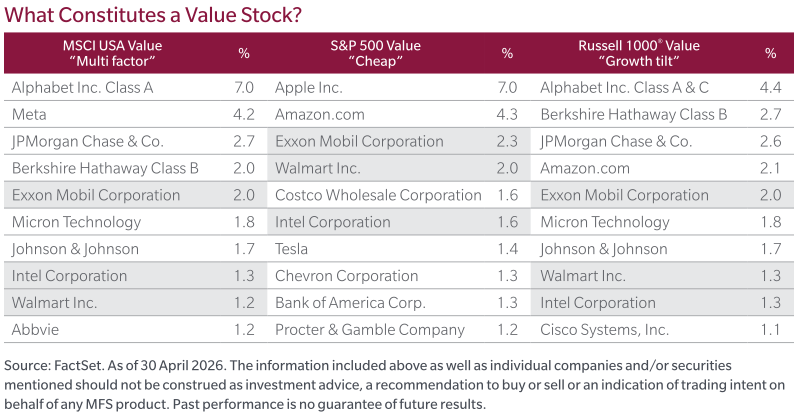
Digging deeper into individual names, as of April 2026, the top 10 holdings of MSCI USA Value, S&P 500 Value, and Russell 1000® Value only have three overlapping names: Exxon Mobil, Intel and Walmart.
Compounding the complexity, index reconstitution, which typically happens on a semiannual or annual basis depending on the provider, can create additional distortions as stocks migrate from one style category to another. Companies might migrate between growth and value classifications and size categories, sometimes just for a brief period. Further muddying the waters, in certain instances, stocks can be prorated between different style indices. Apple is a good example: the stock has been apportioned in part or whole between the Russell 1000® Growth and Russell 1000® Value indices in varying percentages over recent years.
This shifting index landscape poses a challenge for investors, forcing them to consider whether an index’s methodology is consistent with an investment strategy’s role in their portfolio. This question has become more acute in the past few years as the broader market has adopted a greater growth bias. For asset allocators who expect their value strategies to play specific roles, this creates a potential problem and could cause unintended overlap with other allocations in their portfolio. This dynamic could also exacerbate the issue of concentration, which is already embedded in the broader market.
Index Concentration: How Did We Get Here?
US market concentration did not emerge overnight. Regulatory changes, declining IPO activity, accelerating rates of mergers and acquisitions, and the rise of private markets have collectively resulted in a shrinking investable public equity universe, with the largest companies taking an increasing percentage of today’s overall market capitalization. In addition, the technology supercycle of the past 20 years — driven by the rise of mobile, cloud and, most recently, artificial intelligence — has helped drive profits, and subsequently market capitalization, ever higher for the US mega caps. It is difficult to say if, how or when this market structure might change, but we can identify how extreme performance differentials can distort style indices.
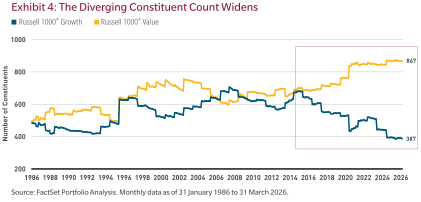
Take the popular Russell 1000® Growth and Value indices, which are benchmarks intended to provide investors with a fair representation of these styles. One key feature of the Russell index construction methodology is they intentionally keep the total market capitalization roughly equal between the growth and value indices. In today’s mega-cap-driven market, this mechanical process has resulted in a significant deviation in the total number of stocks represented in each index, as it requires many modestly sized value names to equal the market capitalization of far fewer mega-cap growth names. The unpleasant math of this approach results in the value index comprising more than twice the number of names in the growth index. In addition, the largest name in the growth index is nearly 5x the weight of the largest value name. This can create significant portfolio construction challenges, making relative weightings more consequential. For example, a half weight of the top Russell 1000® Value holding is 1.3%, while a half weight in the top Russell 1000® Growth holding is 6.6%. These imbalances extend to sector and industry weightings as well.
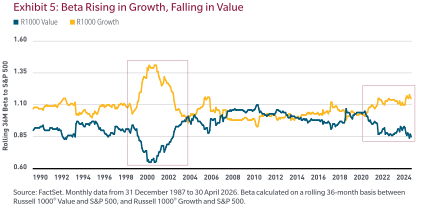
Beta divergences illustrate another significant divide between growth and value indices, creating an additional layer of complexity for investors as they assess benchmarks. We see in the exhibit below that the beta of the growth and value indices (relative to the S&P 500) were close to one another, hovering around 1.0 between 2004 and 2021. More recently, however, these betas have diverged significantly, with the growth index beta rising to nearly 1.2 and the value index beta declining below 0.9. While this recent divergence is not as extreme as during the dot-com period, it is still significant and shows far greater relative risk in growth and far less relative risk in value. We believe that understanding how these index risk profiles can change over time is a valuable input for investors as they measure strategies versus benchmarks.
Reframing Perspectives on Benchmarks
Portfolios are designed to meet client objectives, not simply to mirror an index. Equity benchmarks have acted as important reference tools for more than 140 years and will continue to do so, but their role should be to inform portfolio decisions, not to define them. As the investment environment increases in both size and complexity, we believe investors would be well served to develop a thorough understanding of how their benchmarks are constructed and the various risks these indices present, all of which vary over time in both direction and magnitude.
Past performance is no guarantee of future results.
The information above as well as individual companies and/or securities mentioned should not be construed as investment advice, a recommendation to buy or sell or an indication of trading intent on behalf of any MFS product.
Frank Russell Company (“Russell”) is the source and owner of the Russell Index data contained or reflected in this material and all trademarks, service marks and copyrights related to the Russell Indexes. Russell® is a trademark of Frank Russell Company. Neither Russell nor its licensors accept any liability for any errors or omissions in the Russell Indexes and/or Russell ratings or underlying data and no party may rely on any Russell Indexes and/or Russell ratings and/or underlying data contained in this communication. No further distribution of Russell Data is permitted without Russell’s express written consent. Russell does not promote, sponsor or endorse the content of this communication.
“Standard & Poor’s®” and S&P “S&P®” are registered trademarks of Standard & Poor’s Financial Services LLC (“S&P”) and Dow Jones is a registered trademark of Dow Jones Trademark Holdings LLC (“Dow Jones”) and have been licensed for use by S&P Dow Jones Indices LLC and sublicensed for certain purposes by MFS. The S&P 500® is a product of S&P Dow Jones Indices LLC, and has been licensed for use by MFS. MFS’ Products are not sponsored, endorsed, sold or promoted by S&P Dow Jones Indices LLC, Dow Jones, S&P, or their respective affiliates, and neither S&P Dow Jones Indices LLC, Dow Jones, S&P, their respective affiliates make any representation regarding the advisability of investing in such products. The views expressed in this report are those of MFS and are subject to change at any time.
These views should not be relied upon as investment advice, as securities, recommendations or as an indication of trading intent on behalf of the advisor. Past performance is no guarantee of future results. No forecasts can be guaranteed.
Diversification does not guarantee a profit or protect against a loss. Past performance is no guarantee of future results.