decorative
decorative

EM Local Debt: The Stars May Soon Be Aligning

Emerging market local debt is a cyclical asset class, where each cycle is generally characterized by four stages. As we approach the fourth stage, we believe that local debt could become an attractive option for investors.

Over the past 20 years, emerging market (EM) local debt has been through several cycles. Each cycle has four stages. The fourth stage of the cycle has generally been associated with robust performance of EM local debt. As we approach the fourth stage, we believe that scaling up EM local debt exposure could be an attractive option for investors. 

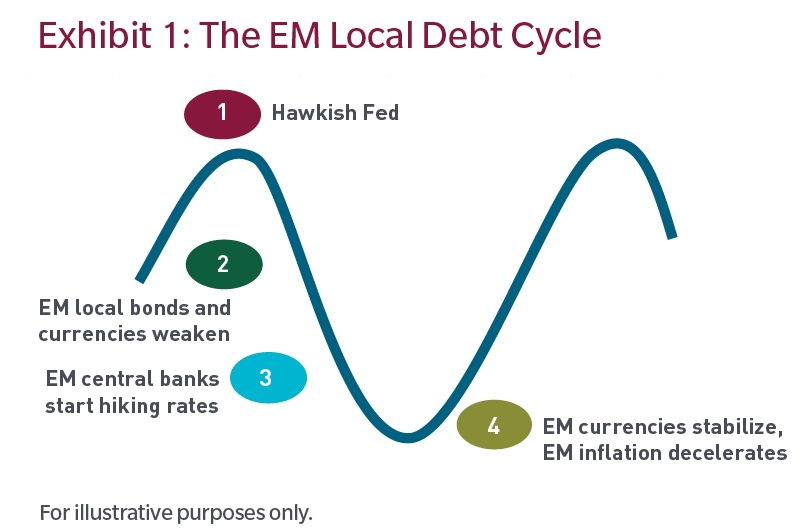
EM local debt is a cyclical asset class because local debt and currency valuations are impacted by central bank policy rates which are being continually adjusted to local business cycle conditions. In turn, EM local business cycle conditions are sensitive to the US business cycle, though the degree of synchronicity varies from cycle to cycle. The typical EM local debt cycle is characterized by four stages (See Exhibit 1):

  1. The US Federal Reserve begins a hiking cycle. Often at this stage in the cycle, EM monetary policy  has become accommodative which supports EM growth and contributes to a widening of EM current account deficits.
  2. EM local bonds and currencies weaken as the Fed’s hiking cycle continues. This prompts EM central banks to start hiking interest rates to stabilize currencies and fight inflation.
  3. Growth slows and the Fed pauses its hiking cycle. Corporate earnings slow together with growth and risk appetite tends to weaken. The weakness in risk appetite puts additional pressure on EM currencies which forces EM central banks to continue hiking rates. The growth slowdown in this stage could be either a soft or hard landing. Which outcome occurs depends on several factors, one of which is the length of the Fed pause. In 2016, the Fed paused after only one rate hike and in 2019 the Fed began to signal rate cuts very early after its final hike in December 2018. Both these episodes resulted in soft landings, though the latter soft landing was then overtaken by the pandemic. 
  4. Fed policy switches to dovish and rate cuts begin. This helps to stabilize risk appetite and lay the foundation for a growth recovery. EM currencies appreciate, inflation decelerates and real yields on local currency debt increase which helps to attract capital inflows. Eventually, EM central banks begin easing monetary policy. This stage has generally been associated with robust performance, local debt performs, rates fall and currencies appreciate. 

In the past, we have witnessed four EM local debt cycles (see Appendix 1). 

Where are we in the current local EM debt cycle? We believe we are currently in the third stage. The Fed is close to pausing. At this juncture, there is one more 25 basis point hike implied by market pricing for the period up to July 2023. In addition, leading economic indicators are pointing to a growth slowdown. Exhibit 3 shows the leading economic indicators for the United States over time. This indicator is at a level consistent with a recession (over the next 12 months). Other indicators, such as the US yield curve, are sending a similar signal. Finally, corporate earnings have been slowing. 

However, markets have not yet shown the decline in risk appetite which typically characterizes the end of stage three. Measures of risk such as corporate spreads, equity volatility and the equity risk premium are not at high enough levels to suggest a meaningful drop in risk appetite.

In our opinion this asset class is attractive in the beginning of stage four, when the Fed is cutting rates, before considering moving overweight EM local debt. The reason is that the decline in risk appetite in stage three typically causes both EM currencies and EM local rates to sell off further, potentially creating attractive long-run valuations for investors.

We feel the fourth stage is relatively attractive for an allocation to EM local debt. However, we are of the view that a partial increase in allocation to EM local debt may be an attractive option at this juncture. 

  1. A key difference in this cycle is that EM central banks led the rate hiking stage. Typically, EM central banks start hiking after the Fed. However, in this cycle EM central banks started hiking before the Fed and they have already tightened monetary policy significantly as shown in Exhibit 4. As a result, carry is very high for many currencies which will help limit their depreciation in stage three.
  2. A soft landing. Though it is not our baseline scenario, a soft landing is a possible outcome of the Fed hiking cycle. In this scenario, we believe the Fed will also cut interest rates, though not by as much as in a hard landing. However, unlike in a hard landing scenario, we think risky assets, including EM currencies, could begin rallying well before the Fed cuts. 
  3. Limited dollar strength in a hard landing. On several metrics, the US dollar appears already overvalued due to the significant appreciation it experienced in 2022.
  4. EM local debt valuations are attractive. This is particularly true on a relative value basis against developed markets, with EM still offering a pickup of some 3% over DM rates despite the major rate correction in the DM world (Exhibit 5). Most EM central banks outside of Asia have hiked policy rates to very high levels and have now paused. The yield on the widely used EM local debt market benchmark, the J.P. Morgan GBI-EM GD index, currently stands at about 7%.1 With both inflation and growth slowing, we think it is unlikely that EM central banks would have to begin hiking again, even in a hard landing scenario (Exhibit 6).
  5. The valuation of EM currencies is also attractive, in our view. A basket of EM currencies currently trades near multi-year lows against a basket of USD/EUR on a real basis — i.e., when factoring the inflation differential between EM and the US and the Eurozone (Exhibit 7).1 Finally, EM currency valuations have historically been positively correlated with commodity prices, but we currently observe that EM currencies have lagged last years’ commodity rally. This may limit EM currency sensitivity to a potential decline in commodity prices as growth slows (Exhibit 8).

EM local debt markets remain supported by robust fundamentals. The external position of EM remains strong, as illustrated by the basic balance — which aggregates the current account balance and foreign debt investment net flows — well into positive territory (Exhibit 9). A strong external position will help EM resilience, in particular the stock of EM foreign exchange reserves, in the face of weakening global growth. 

It is important to emphasize that cyclical timing is only one component of investing in EM local debt. In our view, the most important part of a successful local debt strategy is an investment process centered on strong country selection. Not only do investors need to understand the EM local debt cycle from a global macro top-down perspective, but the EM local debt investment process should also include a robust sovereign credit analysis framework. This is because EM local debt tends to be a high-volatility asset class, primarily due to EM currency exposure. In addition, the dispersion of country fundamental strength is typically significant within EM, as is the return dispersion at the country level, as illustrated by Exhibit 10. As a result, it is essential to focus on local markets that are supported by strong fundamentals and that can exhibit attractive currency appreciation potential. It is important for the investor to understand local monetary policy dynamics as well as local market technical factors, which can impact duration risk.

The fourth stage of current EM local debt cycle is approaching, in our view. This stage has generally been associated with robust performance for EM local debt. We believe that it may be true in the current cycle as well. However, given some of the differences in this cycle with past cycles, we believe that scaling up EM local debt exposure ahead of the fourth stage of the cycle may be an attractive option.

Appendix 1: The Past EM Local Debt Cycles

  • The 2004 to 2006 Fed hiking cycle: While EM local debt performance was initially well supported by the strong global growth backdrop in 2004, tighter Fed policy began to impact EM local debt returns substantially starting in mid-2005. The Fed paused for 14 months before easing in 2008, which laid the foundation for a local debt recovery in 2009. 
  • The 2013 taper tantrum: This was not really a cycle but had some similar effects. In May 2013, Ben Bernanke, the Fed Chair at the time, surprised global markets by signaling a forthcoming tapering of quantitative easing. US Treasury yields spiked and EM local debt performance fell sharply by early 2014 before staging a strong recovery once the taper fears had subsided. 
  • The 2015 liftoff: Over the course of 2015 to 2016, the markets began to price a new Fed hiking cycle. At the same time the US economy was weakening. The Fed delivered the first hike in December 2015 but then quickly went back on hold in January 2016. Markets priced out Fed hikes creating the foundation for double-digit local debt returns in the second half of the year. 
  • The 2018 Fed hiking cycle: By 2018, the Fed’s policy rate had moved into restrictive territory. This caused heightened market volatility that mainly reflected mounting fears of a Fed-induced recession. As a result, EM local debt returns dropped to minus 10% year over year by August 2018.2 The Fed began cutting in 2019 which supported the strong rebound in local debt returns to mid double-digit territory. 

Endnotes

1 Data as of 2 May 2023.
2 Source: Bloomberg, JP Morgan. J.P. Morgan GBI-EM Global Diversified Composite Unhedged USD.


Source: Bloomberg Index Services Limited. BLOOMBERG® is a trademark and service mark of Bloomberg Finance L.P. and its affi liates (collectively “Bloomberg”). Bloomberg or Bloomberg’s licensors own all proprietary rights in the Bloomberg Indices. Bloomberg neither approves or endorses this material or guarantees the accuracy or completeness of any information herein, or makes any warranty, express or implied, as to the results to be obtained therefrom and, to the maximum extent allowed by law, neither shall have any liability or responsibility for injury or damages arising in connection therewith.

Information has been obtained from sources believed to be reliable, but J.P. Morgan does not warrant its completeness or accuracy. The Index is used with permission. The Index may not be copied, used, or distributed without J.P. Morgan’s prior written approval. Copyright 2022, J.P. Morgan Chase & Co. All rights reserved.

The views expressed are those of the author(s) and are subject to change at any time. These views are for informational purposes only and should not be relied upon as a recommendation to purchase any security or as a solicitation or investment advice. No forecasts can be guaranteed.

54902.1
close video