Hedged Global Equity Trust
Hedged Global Equity Trust
- Investment Report |
- NZ PDS |
- AU PDS |
- Fact Sheet |
Investment Objective
The Trust aims to seek capital appreciation over the longer term by investing in an underlying fund, the MFS Global Equity Trust, which itself has a diversified portfolio of global shares, and aims to outperform the MSCI World Index (net dividends reinvested) hedged in AUD over a full market cycle, before taking into account fees, taxes and expenses.
Investment Focus
A core global stock portfolio focused on larger-cap companies
Employs a "growth at a reasonable price" strategy
Managed with a long-term investment horizon
Trust Facts
- Inception Date 27-Jan-2005
- ARSN 112 310 442
- APIR ETL0041AU
- Net Assets (AUD M) As of 30-Sep-26 AUD327.82
- Exit Price As of 16-Oct-26 AUD0.9395
- Most Recent Exit Price Change As of 16-Oct-26 AUD0.0039 | 0.41%
- Management Fee 0.80%
- Buy/Sell Spread 0.15%
- Benchmark MSCI World Index Hedged to AUD (net div)
Managers






Top 10 Holdings
As of 30-Sep-26
- MICROSOFT CORP
- ALPHABET INC
- NVIDIA CORP
- AMAZON.COM INC
- VISA INC
- BROADCOM INC
- SCHNEIDER ELECTRIC SE
- THERMO FISHER SCIENTIFIC INC
- TAIWAN SEMICONDUCTOR MANUFACTURING CO LTD
- ARISTA NETWORKS INC
Important Risk Considerations
All investments carry risks. Different investment strategies may carry different levels of risk, depending on the assets acquired under the strategy.
Please see the Product Disclosure Statement and Reference Guide for detailed risk considerations.
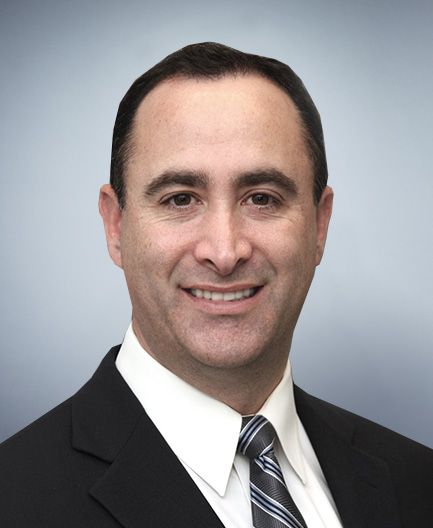
Ryan McAllister, CFA
Portfolio Manager
Ryan P. McAllister, CFA, is an investment officer and equity portfolio manager at MFS Investment Management® (MFS®). He is a member of the firm's global equity portfolio management team.
Ryan joined MFS in 2007 after participating in the MFS Summer MBA Internship Program in 2006. Prior to joining the firm, he served for three years as an assistant vice president in the loan administration/distressed debt group of LaSalle Bank, N.A. and was a basic industries analyst for the investment banking division of Deutsche Bank for two years. He was named portfolio manager in September 2016.
Ryan graduated summa cum laude from the University of Notre Dame, earning his Bachelor of Business Administration degree with a double major in finance and computer applications. He also received his Master of Business Administration degree with honors from the University of Chicago Booth School of Business. He holds the Chartered Financial Analyst (CFA) designation from the CFA Institute.
Our portfolio managers are supported by our entire team of investment professionals in nine worldwide offices. The team employs a proprietary investment process to build better insights for our clients. The core principles of our approach are integrated research, global collaboration, and active risk management.
Colin Moore, CFA
Portfolio Manager
Colin R. Moore, CFA, is an equity portfolio manager at MFS Investment Management® (MFS®). In this role, he is responsible for final buy and sell decisions, portfolio construction, and risk and cash management. He also participates in the research process and strategy discussions. Colin joined MFS in 2014. He worked as an equity research analyst before taking on his current role in 2026. He previously spent eight years as an equity research analyst at Credit Suisse. Colin earned a Bachelor of Commerce degree from McGill University and a Master of Business Administration degree from the University of Western Ontario. He holds the Chartered Financial Analyst designation.
Roger Morley
Portfolio Manager
Roger M. Morley is an investment officer and an equity portfolio manager at MFS Investment Management® (MFS®). He is a co-portfolio manager of MFS Global Equity (since 2009), MFS Global Concentrated Equity (since 2012) and portfolio manager of the MFS Meridian Core European Equity (since 2008). As an equity portfolio manager, Roger is responsible for the final buy and sell decisions, portfolio construction, and risk and cash management. Additionally, he participates in the research process and strategy discussions. Roger is based in MFS' London office.
Roger joined MFS as a research analyst in 2002 and was named portfolio manager in 2009. Prior to joining the firm, he worked in London for Deutsche Bank AG (formerly Bankers Trust Company and Alex. Brown & Sons), first as a financial analyst in the technology and media group and then as an associate in the health care group of the Global Investment Banking department.
Roger is a graduate of Saint Catharine's College, University of Cambridge, where he earned a Master of Arts degree in History. He also earned a Master of Business Administration degree from INSEAD in Fontainebleau, France.
Paul Fairbrother, ASIP
Institutional Portfolio Manager
Paul Fairbrother, ASIP, is an investment officer and institutional equity portfolio manager at MFS Investment Management® (MFS®). In this role, he participates in the research process and strategy discussions, assesses portfolio risk, customizes portfolios to client objectives and guidelines, and manages daily cash flows. He is also responsible for communicating investment policy, strategy and positioning. He is based in London. Paul joined MFS in 2019 in his current role after five years at Sarasin & Partners as a business partner and client account director. Prior to that, he served as a European equity portfolio manager, European equity analyst and UK equity portfolio manager for UBS Asset Management over the course of his 21-year tenure there. He began his career in the financial services industry in 1993. Paul earned a bachelor's degree in business economics from the University of Reading. He is a member of the CFA Institute and an Associate of the CFA Society of the UK (ASIP).
Victoria Higley, ASIP
Institutional Portfolio Manager
Victoria Higley, ASIP, is an investment officer and institutional equity portfolio manager at MFS Investment Management® (MFS®). In her role, she participates in the research process and strategy discussions, assesses portfolio risk, customizes portfolios to client objectives and guidelines and manages daily cash flows. She is also responsible for communicating investment policy, strategy and positioning. Victoria joined MFS in 2011 in her current role. Before that she spent three years at Fidelity International as a UK institutional client director and 14 years at UBS Asset Management as a UK institutional client director, pan-European equity analyst and UK portfolio manager. She began her career in the financial services industry in 1994. Victoria holds a bachelor's degree from Durham University. She is a regular member of the CFA Institute and an Associate of the CFA Society of the UK (ASIP).
Sanjay Natarajan
Institutional Portfolio Manager
Sanjay Natarajan is an investment officer and institutional equity portfolio manager at MFS Investment Management® (MFS®). His responsibilities include communicating investment policy, strategy and positioning and participating in the research process and strategy discussions. His role also includes assessing portfolio risk, customizing portfolios to client objectives and guidelines and managing daily cash flows. He is based in the firm's Singapore office.
Prior to joining the firm in 2007, Sanjay worked for DBS Bank Ltd. (Asia), holding various roles, including serving as COO of Global Corporate and Investment Banking. He also previously worked at McKinsey and Company, k1 Ventures and the Singapore Economic Development Board. He began his career in 1996.
Sanjay earned a bachelor's degree from Dartmouth College and a master's degree from Harvard University.
Our portfolio managers are supported by our entire team of investment professionals in nine worldwide offices. The team employs a proprietary investment process to build better insights for our clients. The core principles of our approach are integrated research, global collaboration and active risk management.
Chris Sunderland
Institutional Portfolio Manager
Chris Sunderland is an investment officer and institutional portfolio manager at MFS Investment Management® (MFS®). As an institutional portfolio manager, he participates in the research process and strategy discussions, assesses portfolio risk, customizes portfolios to client objectives and guidelines, and manages daily cash flows. He is also responsible for communicating investment policy, strategy, and positioning.
Prior to joining MFS in 2015, Chris was a vice president of Eaton Vance Management, director of product and portfolio strategy for equity mandates and an institutional portfolio manager for Eaton Vance's broad suite of equity investment strategies, including US Large Cap Value, Hexavest Global and International Equity, Parametric Emerging Markets and the Richard Bernstein Advisors strategies. Previously, he was affiliated with AXA Investment Managers, where he served as an institutional portfolio manager. Before that, he served as a senior portfolio manager with State Street Global Advisors, where he was responsible for managing U.S. Large-Cap Core and Growth equity strategies. He began his career in the financial services industry at State Street Bank in 1990.
Chris earned a Bachelor of Science degree in finance from Babson College and a Master of Business Administration degree from the F.W. Olin School of Business at Babson College. His commentary has appeared in Institutional Investor, Boston Business Journal, FundFire, Ignites, Bloomberg TV, Fox Business News and the Business News Network.
-
Overview
Investment Objective
The Trust aims to seek capital appreciation over the longer term by investing in an underlying fund, the MFS Global Equity Trust, which itself has a diversified portfolio of global shares, and aims to outperform the MSCI World Index (net dividends reinvested) hedged in AUD over a full market cycle, before taking into account fees, taxes and expenses.
Investment Focus
A core global stock portfolio focused on larger-cap companies
Employs a "growth at a reasonable price" strategy
Managed with a long-term investment horizon
Trust Facts
- Inception Date 27-Jan-2005
- ARSN 112 310 442
- APIR ETL0041AU
- Net Assets (AUD M) As of 30-Sep-26 AUD327.82
- Exit Price As of 16-Oct-26 AUD0.9395
- Most Recent Exit Price Change As of 16-Oct-26 AUD0.0039 | 0.41%
- Management Fee 0.80%
- Buy/Sell Spread 0.15%
- Benchmark MSCI World Index Hedged to AUD (net div)
Managers
![Colin Moore, CFA]()
![Roger Morley]()
![Paul Fairbrother, ASIP]()
![Victoria Higley, ASIP]()
![Sanjay Natarajan]()
![Chris Sunderland]()
Top 10 Holdings
As of 30-Sep-26
- MICROSOFT CORP
- ALPHABET INC
- NVIDIA CORP
- AMAZON.COM INC
- VISA INC
- BROADCOM INC
- SCHNEIDER ELECTRIC SE
- THERMO FISHER SCIENTIFIC INC
- TAIWAN SEMICONDUCTOR MANUFACTURING CO LTD
- ARISTA NETWORKS INC
Important Risk Considerations
All investments carry risks. Different investment strategies may carry different levels of risk, depending on the assets acquired under the strategy.
Please see the Product Disclosure Statement and Reference Guide for detailed risk considerations.
Ryan McAllister, CFA
Portfolio Manager
24YEARS WITH INDUSTRY
19YEARS WITH MFSRyan P. McAllister, CFA, is an investment officer and equity portfolio manager at MFS Investment Management® (MFS®). He is a member of the firm's global equity portfolio management team.
Ryan joined MFS in 2007 after participating in the MFS Summer MBA Internship Program in 2006. Prior to joining the firm, he served for three years as an assistant vice president in the loan administration/distressed debt group of LaSalle Bank, N.A. and was a basic industries analyst for the investment banking division of Deutsche Bank for two years. He was named portfolio manager in September 2016.
Ryan graduated summa cum laude from the University of Notre Dame, earning his Bachelor of Business Administration degree with a double major in finance and computer applications. He also received his Master of Business Administration degree with honors from the University of Chicago Booth School of Business. He holds the Chartered Financial Analyst (CFA) designation from the CFA Institute.
Our portfolio managers are supported by our entire team of investment professionals in nine worldwide offices. The team employs a proprietary investment process to build better insights for our clients. The core principles of our approach are integrated research, global collaboration, and active risk management.
Colin Moore, CFA
Portfolio Manager
20YEARS WITH INDUSTRY
12YEARS WITH MFSColin R. Moore, CFA, is an equity portfolio manager at MFS Investment Management® (MFS®). In this role, he is responsible for final buy and sell decisions, portfolio construction, and risk and cash management. He also participates in the research process and strategy discussions. Colin joined MFS in 2014. He worked as an equity research analyst before taking on his current role in 2026. He previously spent eight years as an equity research analyst at Credit Suisse. Colin earned a Bachelor of Commerce degree from McGill University and a Master of Business Administration degree from the University of Western Ontario. He holds the Chartered Financial Analyst designation.
Roger Morley
Portfolio Manager
30YEARS WITH INDUSTRY
25YEARS WITH MFSRoger M. Morley is an investment officer and an equity portfolio manager at MFS Investment Management® (MFS®). He is a co-portfolio manager of MFS Global Equity (since 2009), MFS Global Concentrated Equity (since 2012) and portfolio manager of the MFS Meridian Core European Equity (since 2008). As an equity portfolio manager, Roger is responsible for the final buy and sell decisions, portfolio construction, and risk and cash management. Additionally, he participates in the research process and strategy discussions. Roger is based in MFS' London office.
Roger joined MFS as a research analyst in 2002 and was named portfolio manager in 2009. Prior to joining the firm, he worked in London for Deutsche Bank AG (formerly Bankers Trust Company and Alex. Brown & Sons), first as a financial analyst in the technology and media group and then as an associate in the health care group of the Global Investment Banking department.
Roger is a graduate of Saint Catharine's College, University of Cambridge, where he earned a Master of Arts degree in History. He also earned a Master of Business Administration degree from INSEAD in Fontainebleau, France.
Paul Fairbrother, ASIP
Institutional Portfolio Manager
33YEARS WITH INDUSTRY
7YEARS WITH MFSPaul Fairbrother, ASIP, is an investment officer and institutional equity portfolio manager at MFS Investment Management® (MFS®). In this role, he participates in the research process and strategy discussions, assesses portfolio risk, customizes portfolios to client objectives and guidelines, and manages daily cash flows. He is also responsible for communicating investment policy, strategy and positioning. He is based in London. Paul joined MFS in 2019 in his current role after five years at Sarasin & Partners as a business partner and client account director. Prior to that, he served as a European equity portfolio manager, European equity analyst and UK equity portfolio manager for UBS Asset Management over the course of his 21-year tenure there. He began his career in the financial services industry in 1993. Paul earned a bachelor's degree in business economics from the University of Reading. He is a member of the CFA Institute and an Associate of the CFA Society of the UK (ASIP).
Victoria Higley, ASIP
Institutional Portfolio Manager
33YEARS WITH INDUSTRY
15YEARS WITH MFSVictoria Higley, ASIP, is an investment officer and institutional equity portfolio manager at MFS Investment Management® (MFS®). In her role, she participates in the research process and strategy discussions, assesses portfolio risk, customizes portfolios to client objectives and guidelines and manages daily cash flows. She is also responsible for communicating investment policy, strategy and positioning. Victoria joined MFS in 2011 in her current role. Before that she spent three years at Fidelity International as a UK institutional client director and 14 years at UBS Asset Management as a UK institutional client director, pan-European equity analyst and UK portfolio manager. She began her career in the financial services industry in 1994. Victoria holds a bachelor's degree from Durham University. She is a regular member of the CFA Institute and an Associate of the CFA Society of the UK (ASIP).
Sanjay Natarajan
Institutional Portfolio Manager
30YEARS WITH INDUSTRY
19YEARS WITH MFSSanjay Natarajan is an investment officer and institutional equity portfolio manager at MFS Investment Management® (MFS®). His responsibilities include communicating investment policy, strategy and positioning and participating in the research process and strategy discussions. His role also includes assessing portfolio risk, customizing portfolios to client objectives and guidelines and managing daily cash flows. He is based in the firm's Singapore office.
Prior to joining the firm in 2007, Sanjay worked for DBS Bank Ltd. (Asia), holding various roles, including serving as COO of Global Corporate and Investment Banking. He also previously worked at McKinsey and Company, k1 Ventures and the Singapore Economic Development Board. He began his career in 1996.
Sanjay earned a bachelor's degree from Dartmouth College and a master's degree from Harvard University.
Our portfolio managers are supported by our entire team of investment professionals in nine worldwide offices. The team employs a proprietary investment process to build better insights for our clients. The core principles of our approach are integrated research, global collaboration and active risk management.
Chris Sunderland
Institutional Portfolio Manager
36YEARS WITH INDUSTRY
11YEARS WITH MFSChris Sunderland is an investment officer and institutional portfolio manager at MFS Investment Management® (MFS®). As an institutional portfolio manager, he participates in the research process and strategy discussions, assesses portfolio risk, customizes portfolios to client objectives and guidelines, and manages daily cash flows. He is also responsible for communicating investment policy, strategy, and positioning.
Prior to joining MFS in 2015, Chris was a vice president of Eaton Vance Management, director of product and portfolio strategy for equity mandates and an institutional portfolio manager for Eaton Vance's broad suite of equity investment strategies, including US Large Cap Value, Hexavest Global and International Equity, Parametric Emerging Markets and the Richard Bernstein Advisors strategies. Previously, he was affiliated with AXA Investment Managers, where he served as an institutional portfolio manager. Before that, he served as a senior portfolio manager with State Street Global Advisors, where he was responsible for managing U.S. Large-Cap Core and Growth equity strategies. He began his career in the financial services industry at State Street Bank in 1990.
Chris earned a Bachelor of Science degree in finance from Babson College and a Master of Business Administration degree from the F.W. Olin School of Business at Babson College. His commentary has appeared in Institutional Investor, Boston Business Journal, FundFire, Ignites, Bloomberg TV, Fox Business News and the Business News Network.