
It is crucial that proper diversification also occurs beneath the surface of these broad asset classes — across equity styles, market capitalizations, duration profiles, credit exposures, and other underlying sources of risk and return. As multi-asset investors, this is an extremely important consideration in our portfolio construction process.
This deeper layer of diversification matters because assets that appear similar at a high level can produce very different investor experiences over time. Even within highly correlated risky assets, long-term outcomes can diverge sharply, leadership can rotate unpredictably, and concentrated exposures can remain out of favor for years. In this paper, we examine how diversification within risky assets may improve the investor experience by reducing the substantial risk of being concentrated in a lagging market cohort and mitigating the severity and duration of market stress events.
High Correlation Does Not Mean Similar Outcomes
We begin by examining four US equity cohorts: large-cap value, large-cap growth, mid-cap, and small-cap. These ostensibly similar market segments have (unsurprisingly) exhibited highly correlated monthly returns, as shown in Exhibit 1.
Exhibit 1: Monthly Returns Have Been Highly Correlated Across US Equity Cohorts
|
Large-cap Growth |
Large-cap Value |
Mid-cap |
Small-cap |
Large-cap Growth |
1.00 |
|
|
|
Large-cap Value |
0.89 |
1.00 |
|
|
Mid-cap |
0.92 |
0.96 |
1.00 |
|
Small-cap |
0.84 |
0.89 |
0.95 |
1.00 |
Sources: Kenneth R. French Data Library, FactSet and MFS Calculations.1 Past performance is no guarantee of future results. It is not possible to invest directly in an index.
Importantly, however, one should not see these correlations and assume these market segments are interchangeable. Over longer-term horizons, realized returns within equity market cohorts like these can diverge widely, and relative leadership can shift substantially. For those saving for the future, these long-horizon returns are what truly matter, more so than the month-to-month similarities in price movement. We provide further analysis in regards to long-term return differentials and leadership changes in Exhibit 2.
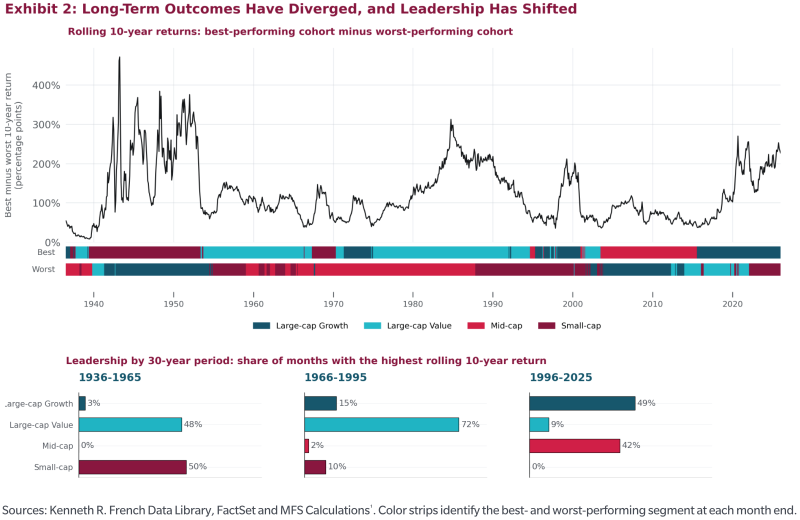
The top panel of Exhibit 2 shows the difference between the 10-year rolling returns of the best and worst of these four US equity asset classes, highlighting how even highly correlated market segments can deliver meaningfully different outcomes when measured over longer periods of time. Put simply: do not be fooled by a roughly 90% correlation in monthly returns; the gap between the best- and worst-performing cohorts’ cumulative 10-year returns has frequently exceeded 150 percentage points, and at times been considerably higher.
The middle panel of Exhibit 2 is a “leadership bar” that visually demonstrates which segments delivered the best (and worst) trailing 10-year returns at any point in time. This offers another important takeaway, though perhaps a more subtle one: while each of the US equity cohorts spends time at both the top and bottom of the leaderboard, any meaningful pattern, persistence, or trend is difficult to identify. No single cohort dominates the top of the leaderboard, and very often, the winners of the past are the laggards of the future.
This lack of trends, patterns, or persistence is further detailed in the bottom panel of Exhibit 2, which displays each cohort’s share of time spent atop the leaderboard for all three 30-year periods across our sample. Very often, the shining star of one period becomes a relative laggard in the next. And, just as often, an out-of-favor cohort stages some redemption in a future period.
An investor who extrapolates from the prior experience might be in for some disappointment. With leadership changes difficult to predict and return dispersion having the potential to be meaningful, a disciplined asset allocator may be wise to avoid concentrating exposure in a single cohort. The cost of being wrong, it should be obvious by now, can be substantial, as we will examine next.
The Cost of Being Concentrated — and Wrong
In our view, a key benefit of diversification is reducing the risk of being concentrated in the weakest-performing segment. Exhibit 3 quantifies what we call “regret avoidance,” which we define as the degree to which an equally weighted portfolio of these four US equity cohorts outperforms the worst individual segment over a 10-year period. This difference represents the degree to which diversification would have helped an investor avoid the pain of being concentrated in the worst-performing cohort.
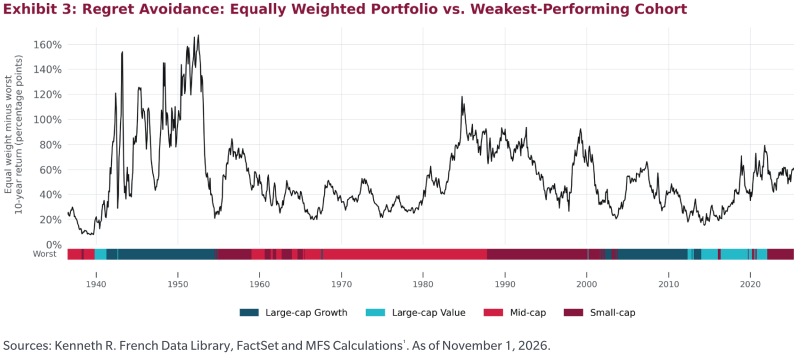
The diversified portfolio outperformed the worst-performing cohort by approximately 60 percentage points (on average) of cumulative 10-year returns over this timeframe, and at times, this outperformance surpassed 100%. In other words, the unfortunate investor who concentrated in the wrong risky asset cohort would have dug themselves a massive hole. While it can be tempting to attempt to identify the strongest-performing cohort ex-ante, the risk of being wrong is substantial. Avoiding this risk is a meaningful benefit of diversification.
Exhibit 4 shows that none of these asset classes have avoided being the laggard of the group, and each has spent meaningful time in last place (as measured by their share of periods with rolling 10-year returns ranked last, shown in the first column). Importantly, the second column shows that an investor experiencing unfortunate concentration should not count on a quick recovery, as most assets have demonstrated an ability to remain in last place for a decade or more. The third column shows that an investor concentrated in the wrong cohort can lag a diversified portfolio for exceptionally long periods of time.
Exhibit 4: Lagging Assets Can Stay Out of Favor for Decades
Segment |
Share of rolling |
Longest continuous run |
Longest continuous run belowequal |
Large-cap Growth |
27% |
12 |
15 |
Large-cap Value |
11% |
3 |
15 |
Mid-cap |
32% |
20 |
39 |
Small-cap |
31% |
12 |
21 |
Sources: Kenneth R. French Data Library, FactSet and MFS Calculations.1 As of November 1, 2026.
Note: Runs are based on consecutive monthly rolling 10-year observations.
The key takeaway from Exhibits 3 and 4 is that the risks of concentration are steep: being wrong can have a dramatic impact on returns that can persist for substantial periods of time. Diversification can help investors avoid significant setbacks that may be difficult — even impossible — to overcome.
Diversification During Drawdowns and Recoveries
The benefits of diversification are not limited to long-term outcomes. They are also present during acute periods of market stress, when drawdown severity and recovery time become especially important for investors.
To illustrate this, we will now broaden the investment opportunity set beyond the US equity cohorts to include international equities, REITs, and commodities, creating a diversified portfolio that resembles a risky asset mix that might be used in multi-asset strategies.
No risky asset is immune to severe drawdowns, which not only stress portfolio value but also test investor behavior. Drawdowns can both destroy wealth and drive suboptimal investor behavior — such as capitulation at the wrong time. Reducing drawdown severity and shortening recovery time are crucially important in the savings journey, as both can help investors remain committed to their long-term allocation when market stress is most difficult to endure. We find that diversification helps along both of these dimensions.
Exhibit 5 compares the 10 largest drawdowns across risk assets since 1972, when data for the broader opportunity set become available. All seven asset classes appear at least once among the 10 observations. For each episode, we also show the performance and recovery time that would have occurred using a diversified portfolio of risk assets.2 The hypothetical diversified portfolio experienced meaningfully smaller drawdowns and faster recoveries on average than the individual assets’ episodes. Diversification resulted in meaningful improvements in drawdown severity (-22% diversified portfolio vs. -62% individual-asset average) and recovery time (3.0 years vs. 4.8 years). This is a significant improvement for investors, both economically and psychologically.
Exhibit 5: Largest Drawdowns and Diversification Effects
Asset/Period |
Asset Drawdown |
Diversified Portfolio Return (Same Period) |
Asset Recovery (Years) |
Diversified Portfolio Recovery (Years) |
Commodities |
-74% |
83% |
N/A |
N/A |
Real Estate |
-70% |
-51% |
4.1 |
2.2 |
Large-cap Growth |
-69% |
-41% |
5.8 |
1 |
Real Estate |
-64% |
-39% |
7.9 |
3.3 |
Small-cap |
-62% |
-35% |
3.6 |
2.0 |
International Equities |
-57% |
-54% |
5.3 |
3.9 |
Large-cap Value |
-57% |
-54% |
4.1 |
3.9 |
Commodities |
-57% |
69% |
18.2 |
N/A |
Mid-cap |
-56% |
-54% |
2.2 |
3.9 |
Mid-cap |
-56% |
-42% |
5.8 |
3.6 |
Average |
-62% |
-22% |
4.8 |
3.0 |
Sources: LSEG DataStream and MFS calculations.2
Note: Recovery averages include only episodes with both recovery measures. N/A indicates no drawdown to recover from or no recovery by the end of the sample. This hypothetical example is for illustrative purposes only. It does not represent any MFS product.
Conclusion
Risky assets, even highly correlated ones, are not created equal. Diversification efforts should extend beyond the broad “stocks versus bonds” decision and into the underlying exposures that shape portfolio outcomes over time. Being overly concentrated in a single area of risk assets can lead to meaningful underperformance, prolonged return disappointment, deeper drawdowns, and longer recovery periods.
As multi-asset investors, the practical implication is clear: diversification should be intentional at multiple levels of portfolio construction. By maintaining a broad mix of underlying exposures, investors can reduce reliance on any single source of return and seek a more stable investment experience through time. In our view, the objective is not to consistently own tomorrow’s winner, but to build portfolios that remain resilient through a broader range of market conditions, regardless of which market segments lead or lag.
Endnotes
1 Exhibits 1–4 use monthly returns from the Kenneth R. French Data Library from July 1926 through December 1984 and Russell index returns from FactSet from January 1985 through December 2025, net of the one-month risk-free rate. Large-cap growth, large-cap value, mid-cap and small-cap are represented by the Russell 1000® Growth, Russell 1000® Value, Russell Midcap® and Russell 2000® indexes, respectively; earlier series are authors’ calculations using Kenneth French data. Rolling 10-year measures use trailing 120-month cumulative returns.
2 Exhibit 5 uses monthly excess returns beginning in 1972. The diversified portfolio comprises 17.5% large-cap growth, 17.5% large-cap value, 20% mid-cap, 5% small-cap, 30% international equities, 5% commodities and 5% real estate. Large-cap growth, large-cap value, mid-cap and small-cap, international equities, commodities, and real estate are represented by the Russell 1000® Growth, Russell 1000® Value, Russell Midcap®, Russell 2000®, MSCI EAFE, Bloomberg Commodity, and FTSE® Nareit All REITs Indexes, respectively. Portfolio return is measured over each asset’s peak-to-trough period. Asset recovery is measured from the asset trough until the asset regains its prior peak; portfolio recovery is measured from the same trough until the diversified portfolio regains its value on the asset’s peak date.
Frank Russell Company (“Russell”) is the source and owner of the Russell Index data contained or reflected in this material and all trademarks, service marks and copyrights related to the Russell Indexes. Russell® is a trademark of Frank Russell Company. Neither Russell nor its licensors accept any liability for any errors or omissions in the Russell Indexes and/or Russell ratings or underlying data and no party may rely on any Russell Indexes and/or Russell ratings and/or underlying data contained in this communication. No further distribution of Russell Data is permitted without Russell’s express written consent. Russell does not promote, sponsor or endorse the content of this communication
Source: Bloomberg Index Services Limited. BLOOMBERG® is a trademark and service mark of Bloomberg Finance L.P. and its affiliates (collectively “Bloomberg”). Bloomberg or Bloomberg’s licensors own all proprietary rights in the Bloomberg Indices. Bloomberg neither approves or endorses this material, or guarantees the accuracy or completeness of any information herein, or makes any warranty, express or implied, as to the results to be obtained therefrom and, to the maximum extent allowed by law, neither shall have any liability or responsibility for injury or damages arising in connection therewith.
Source FTSE International Limited (“FTSE”) © FTSE 2026. “FTSE®” is a trade mark of the London Stock Exchange Group companies and is used by FTSE International Limited under licence.
“FT-SE®”, “FOOTSIE®”, and “FTSE4GOOD®” are trade marks of the London Stock Exchange Group companies. “Nareit®” is a trade mark of the National Association of Real Estate Investment Trusts (“Nareit”) and “EPRA” is a trade mark of the European Public Real Estate Association (“EPRA”) and all are used by FTSE International Limited (“FTSE”) under licence. The FTSE EPRA Nareit Index is calculated by FTSE. Neither FTSE, Euronext N.V., Nareit nor EPRA sponsor, endorse or promote this product and are not in any way connected to it and do not accept any liability. All intellectual property rights in the index values and constituent list vests in FTSE, Euronext N.V., Nareit and EPRA. Neither FTSE nor its licensors accept any liability for any errors or omissions in the FTSE indices and/or FTSE ratings or underlying data. No further distribution of FTSE Data is permitted without FTSE’s express written consent.
Index data source: MSCI. MSCI makes no express or implied warranties or representations and shall have no liability whatsoever with respect to any MSCI data contained herein. The MSCI data may not be further redistributed or used as a basis for other indices or any securities or financial products. This report is not approved, reviewed or produced by MSCI.
The information included in this document is current as of November 1, 2026, and any additions, modifications or deletions to this information that have occurred since that date are not reflected.
The views expressed in this report are those of MFS and are subject to change at any time. These views should not be relied upon as investment advice, as securities, recommendations or as an indication of trading intent on behalf of the advisor. Past performance is no guarantee of future results. No forecasts can be guaranteed. Diversification does not guarantee a profit or protect against a loss.
Disclosure: Unless otherwise indicated, logos and product and service names are trademarks of MFS® and its affiliates and may be registered in certain countries. Distributed by: U.S. – MFS Institutional Advisors, Inc. (“MFSI”), MFS Investment Management and MFS Fund Distributors, Inc., Member SIPC; Canada – MFS Investment Management Canada Limited.
AUTHORS
Erich Shigley, CFA
Quantitative Portfolio Manager
Derek Beane, CFA
Multi-Asset Institutional Portfolio Manager
Stephanie Lo, PHD
Quantitative Research Analyst