decorative
decorative

The Increasing Need to Reach Deeper Into the Tool Box

We have begun a new regime, where investors will need to do a lot more homework and may find it advantageous to use a mosaic of not only valuation, but also fundamental tools, to help guide the way through this cycle.

In brief

  • Expanding earnings multiples and falling risk premia suggest stocks are expensive
  • Understanding the flaws in valuation metrics has value
  • Today’s environment would seem not to support an elevated price-to-sales ratio

Expanding equity multiples and falling risk premia

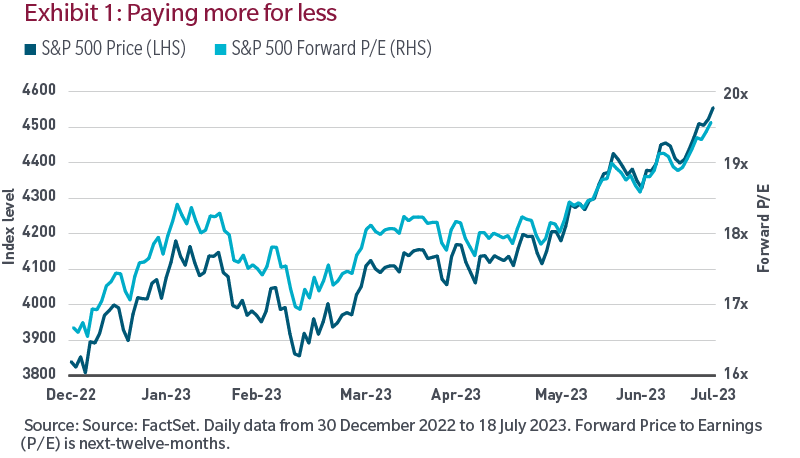
Enthusiasm around artificial intelligence, falling inflation readings and better-than-feared economic data have all been contributing forces to the strength in global equity markets this year. At the same time, earnings growth expectations have been low to slightly negative. With the prices being paid for stocks rising, unaccompanied by higher profit expectations, the P/E multiple on stocks has expanded as shown in Exhibit 1. Investors are paying a lot more for the same profit stream.

We can also observe this through the lens of equity risk premia. The expected earnings yield on stocks over the yield offered by government bonds has historically averaged 3% to 5%. The combination of interest rates at more normal, free-market levels following the rate-hiking cycle begun in 2022 and this year’s equity market rally has pushed risk premia to extremes not seen since the internet bubble. The chart on the right illuminates the negative risk premia for the technology-heavy Nasdaq 100.

A lesson from George Box

Many of today’s investors, professional or not, have never experienced a market like this before. They’ve become conditioned to rising markets and a system that allowed for the privatization of profits and wealth and the socialization of capital losses when markets exhibited sustained stress.

Given that many in today’s marketplace are dismissing these warnings signals, perhaps we need to take a different perspective.

Famed British statistician George Box felt all models are inherently flawed by nature of being rooted in the past but understanding those flaws has value. That knowledge allows you to vary the weightings or emphasis placed on different inputs given the assumed or perceived circumstances and differences compared with the past.

Price-to-sales

Earlier, I referred to the internet bubble. Since it popped over two decades ago, many current investors weren’t managing portfolios then, yet most are at least familiar with the circumstances surrounding that historic episode.

What is often most remembered were the skyrocketing valuations of businesses with a .com or .net attached to it. But what often gets left out is the enormous capital cycle that the internet created. Computers were being put onto every desktop and connected to each other via the internet. This catalyzed a corporate investment cycle that drove exploding economic and sales growth. Nonetheless, valuations were so outrageous that despite the enormous growth, stocks were very expensive even on a price-to-sales ratio basis.

But the post-2008 business cycle was entirely different. There was no capital expenditure cycle. Deflation fears, falling money velocity and weak end-demand diverted borrowed corporate capital away from fixed investment (e.g., equipment) towards stock repurchases, higher dividends and acquisitions. That combination resulted in the weakest business cycle in over a century and in historically anemic sales growth. Yet stocks did fantastically well because companies were able to drive profitability by suppressing costs amid falling interest expense, the offshoring of labor and falling fixed investment. However, that regime died in 2022, and profit subsidies from low rates, offshoring and underinvestment have not only ended, but reversed.

Given how short-term and linear many equity investors are, perhaps forward twelve-month price-to-earnings ratios and earnings yields understate the risks. Leveraging the George Box playbook, Exhibit 3 shows the price-to-sales ratio for the S&P 500 since the mid-1990s.

As noted earlier, despite the high-growth era of the 1990s, equities were expensive even on this growth-dependent metric. Not surprisingly, given how weak the economy and sales growth were throughout the post-2008 business cycle, we saw the ratio expand and reach peaks last seen at the height of the internet bubble. Price-to-sales-fell some in 2021 due to the post-lockdown growth that resulted from fiscal and monetary stimulus, which has since faded and why the ratio is re-accelerating, as stock prices have risen in 2023.

Conclusion

Equities are expensive on traditional valuation measures. The bigger picture, however, is more nuanced. The regime of low capital costs has ended as accumulated debt levels will need to be financed at higher cost, pulling down free cash flow. The cheap labor regime has ended. And the regime of over-stretched supply chains and underinvestment in cleaner (energy) ways of running businesses has ended.

Back to Mr. Box’s axiom about models being wrong but some useful, I think of valuation similarly. Every business cycle and market environment is different, and these idiosyncrasies influence the usefulness of various valuation metrics and are why a broad mosaic of valuation inputs, and understanding the flaws in each, can be instructive.

We have begun a new regime. A regime where capital and labor are scarcer than any point since 2009. A regime where not all companies will be able to outearn their new or normalized input costs. A regime of higher loan and bond defaults, capital restructurings and bankruptcies. The tools necessary to successfully navigate the current regime are quite different from the last. As Mr. Box might have suggested, recognize that all valuation and fundamental models are broken, but some are still useful. Investors will need to do a lot more homework and may find it advantageous to use a mosaic of not only valuation, but also fundamental tools, to help guide the way through this cycle.


The price-earnings ratio is calculated by dividing a company’s share price by its earnings per share.

The price to sales ratio measures the value of a company in relation to the total amount of its recent annual sales.

The S&P 500 Index measures the performance of the 500 largest US publicly traded companies in the US equity market.

The Nasdaq 100 is an index of the hundred largest non-financial stocks listed on the NASDAQ stock exchange.

“Standard & Poor’s®” and S&P “S&P®” are registered trademarks of Standard & Poor’s Financial Services LLC (“S&P”) and Dow Jones is a registered trademark of Dow Jones Trademark Holdings LLC (“Dow Jones”) and have been licensed for use by S&P Dow Jones Indices LLC and sublicensed for certain purposes by MFS. The S&P 500® is a product of S&P Dow Jones Indices LLC, and has been licensed for use by MFS. MFS’s Products are not sponsored, endorsed, sold or promoted by S&P Dow Jones Indices LLC, Dow Jones, S&P, or their respective affiliates, and neither S&P Dow Jones Indices LLC, Dow Jones, S&P, their respective affiliates make any representation regarding the advisability of investing in such products.

The views expressed are those of the author(s) and are subject to change at any time. These views are for informational purposes only and should not be relied upon as a recommendation to purchase any security or as a solicitation or investment advice. No forecasts can be guaranteed.

55514.1
close video